How much do you really know about your customers?
In the highly competitive market where attention to your brand is the commodity, having unobstructed access to your high-quality data, and the ability to drive insights from them, could make or break your business.
The problem, however, is that too many businesses choose to ignore data. In fact, according to a 2019 survey composed of 64 C-level executives for major brands, 72% have yet to forge a data culture and 52% admit that they’re not even competing in data and analytics.
Others may think that they’re using their superior customer experience to determine the right course of action or relying on company history to fuel their decisions. But unless you have hard data to back your assumptions, you’re only guessing.
There are three metrics that every ecommerce merchant should be tracking to better understand the health of their subscription business:
- Lifetime value (LTV) of each customer
- Total monthly recurring revenue (MRR)
- Percent growth (inversely, total churn volume)
Keeping churn low while growing MRR can mean dominating your niche and increasing the ability to reinvest in your business compared to with fighting seasonality or flash sale success.
That’s where our Enhanced Analytics feature makes its greatest impact.
Why we built enhanced analytics
When we started building a platform that provides data insights for a wide variety of verticals, we wanted to focus on what Recharge merchants care most about across the board:
- LTV: Lifetime Value of each customer. Knowing this number and your cost of acquisition will help you tip the scales of a subscription-model business towards success.
- ARPU: Average Revenue Per User. Divide your total revenue over the average subscribers in a given period and you’ll have ARPU, which helps you measure your revenue trends.
- Churn/Retention: Churn comes down to one number – how many customers stop being customers over a given period (frequently over a monthly basis). But it’s not just about whether your customers are sticking around, it’s just as important to understand how quickly your subscriber base is growing. Use the provided churn analysis report to analyze when and why subscribers may be dropping.
- Campaign tracking: Cohort analysis allows you to draw a correlation between new initiatives and base level performance. This gives you critical insights into what actions and reactions are having the best effects on your sales.
These are the core numbers that play a part in your revenue – and you can find those insights with Enhanced Analytics.
Enhanced analytics: A deep dive into functionality
Analytics shouldn’t exist in a vacuum. Instead, analytics should be a key component of your marketing.
We approached the launch of Recharge Enhanced Analytics with a three-pillar strategy:
- Transparency: Analytics should illustrate all important data for maximum transparency. Data needs to be clear, actionable, and revealing if it’s going to make a difference in future decisions.
- Forecasting: The past is often a helpful indicator when it comes to looking ahead to the future – and subscription-based businesses need accurate forecasting to diagnose these trends. That’s why we made accurate forecasting a major part of Enhanced Analytics.
- Insight: It’s not enough to have numbers. What do the numbers mean, and how do you translate them into actionable outcomes? Enhanced Analytics dives into more than just what’s happening. It reveals why many customers are making decisions that lead to churn.
Recharge merchants are highly diverse – even within the same vertical, no two businesses require the same insights. When building Enhanced Analytics we stuck to our core three principles above as a guiding light. We can’t assume we know the specific data points your business intends to analyze. However, we can provide a robust, customizable platform you can manipulate in order to more effectively make use of your customer data.
How to navigate the new dashboard
When you log in to Enhanced Analytics, you’ll notice that all dashboards default to the previous 30 days. However, you’re not limited to month-over-month. The option for “dynamic date range filtering” is available to give you any insight you need.
With these dashboards, you can drill down on any detail. Click on any bar chart or line graph and you’ll see the individual line items that make up the larger data set. You can then export/download these reports according to your specifications.
Where do the insights start? Here’s a look at each of the individual dashboards:
Revenue trends
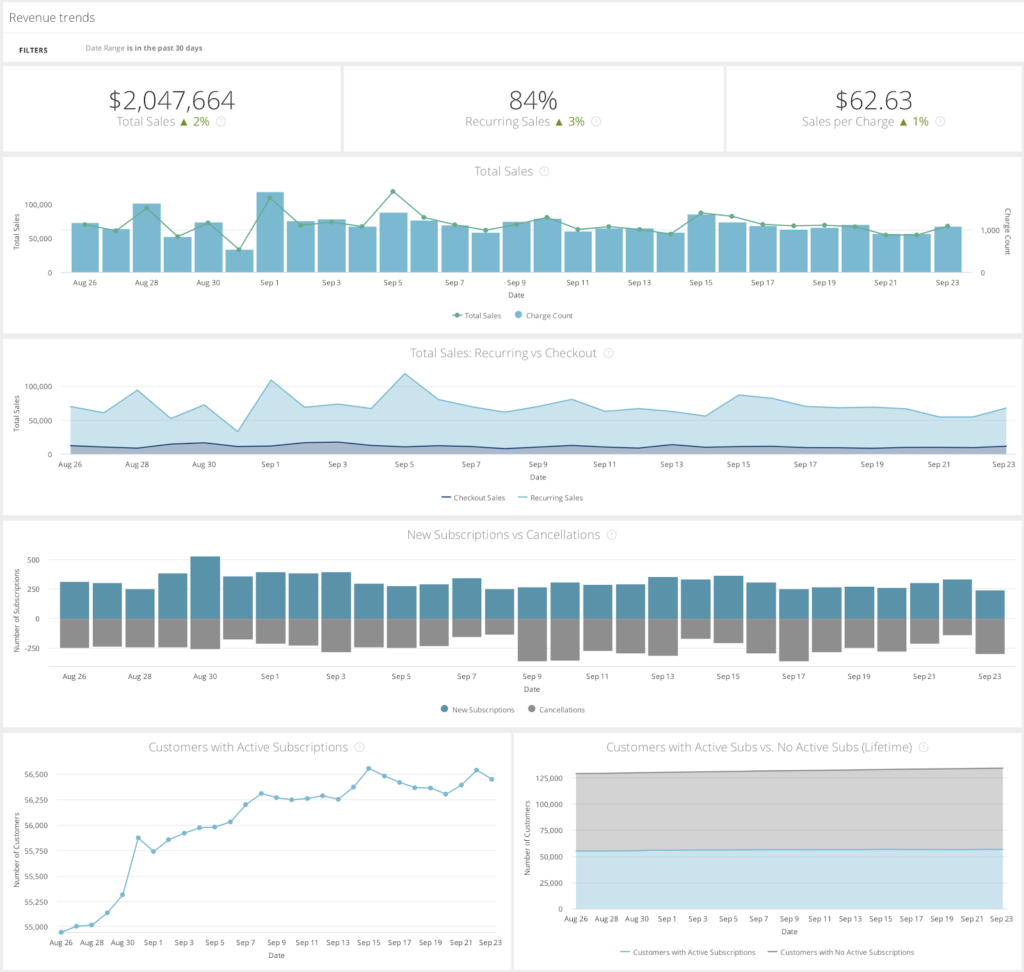
Think of this as your high-level snapshot of the health of your business. Log in and you’ll get a quick sense of which way your business is trending.
Enhanced Analytics includes the following crucial data points:
- Overview of Sales: Gives a bird’s-eye view of all sales made within a period.
- Active Customers: Indicates how many customers are currently subscribed.
- Subscription Creations/Cancellations within Date Range: Tracks the changes in a given period by showing the creations, cancellations, and the overall net effect.
- Recurring vs. Checkout Sales: A checkout sale is the first purchase of a subscription or a “one-time product” sale. A recurring sale is any subsequent sale auto-charged to a customer who’s already signed up.
- Sales per Charge: Essentially, your Average Order Value (AOV). How much is each customer charging on average within the time period you selected?
- Total Customers with Average Subscriptions: How many customers do you have now? Understand the trend lines to discover future revenue potential.
Customer cohort
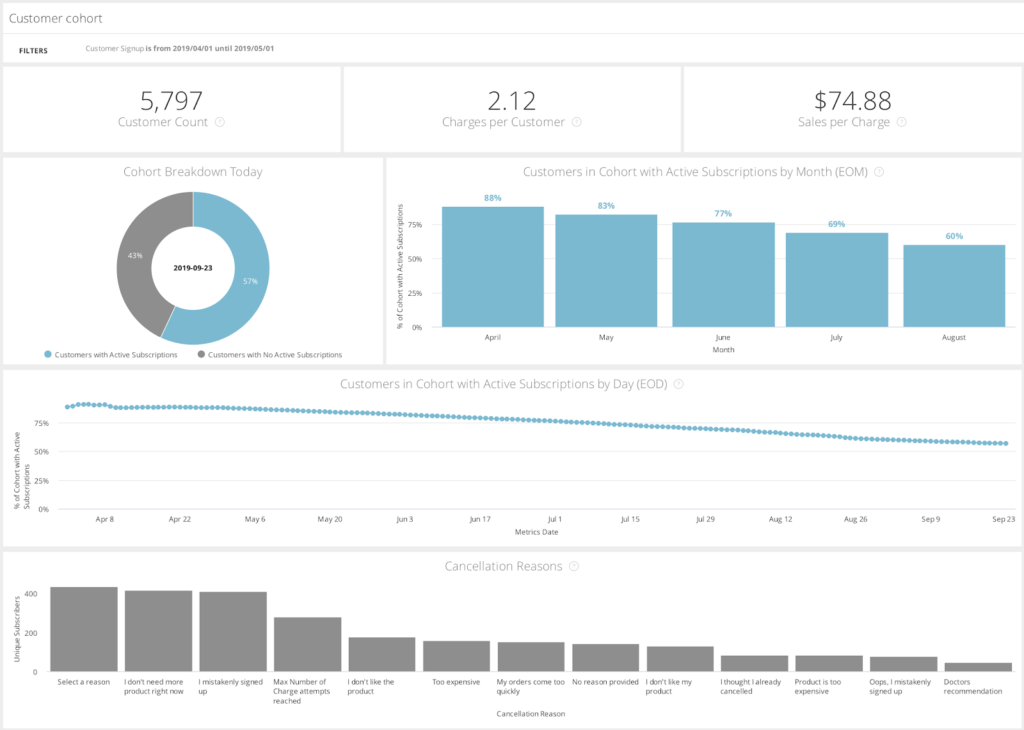
The dynamic cohort selection helps you measure how well your customers are holding on once they’ve become customers. This gives you insight into customer churn and key data points on your marketing campaigns.
Here are some of the essential features:
- Churn By Cohort: View your customer churn numbers within the specific cohort of sign-ups within your selected time period. This allows you to track changes in customer churn over time.
- Custom Definition: Your measurement of a cohort works best when you define your custom cohorts for specific measurement. That includes sorting a cohort on a specific sign-up date. This is great for measuring the success of flash sales, special offers, and other marketing campaigns.
- Charges per Customer: Answers the question: How many charges do you average per customer within a specific date range?
- Active Subscriptions: View how many customers purchased within a specific time frame.
- Active Subscriptions by Day: You don’t need to limit yourself to data sets over a month. Get specific about your subscriptions to see what strategies are working best day by day.
- Cancellation Reasons: It’s not enough to know that customers have canceled. This feature helps you pinpoint why customers are canceling.
Cohort retention
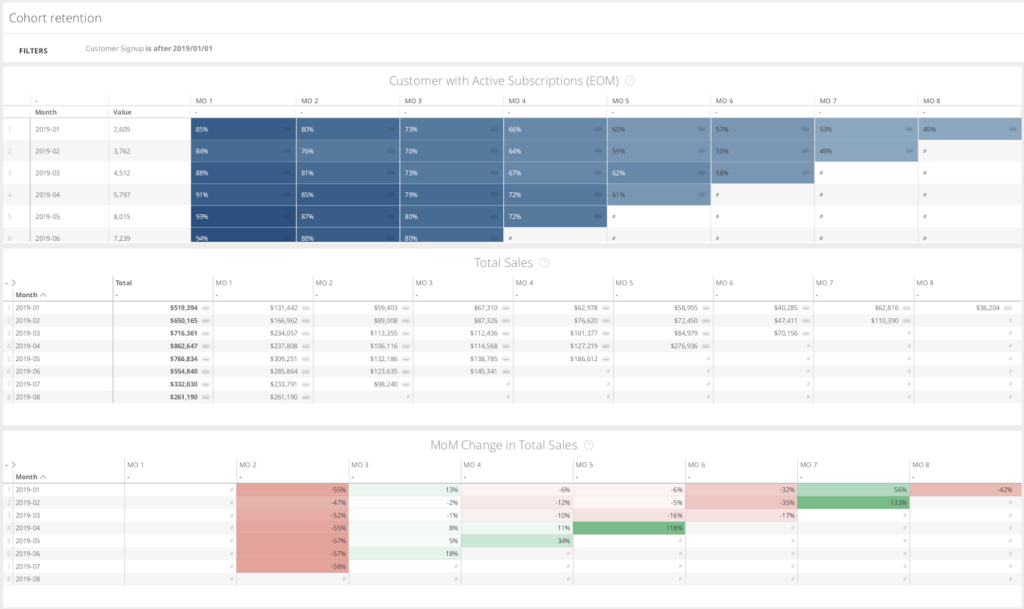
Merchants selling subscriptions know that retention is just as important as acquisition. So is the data. Using the Cohort Retention features, you’ll track the value of customers and learn more about their behavior with specific parameters.
Here are some of the features:
- Cohort Side-by-Side Comparisons: Find out what your cohorts look like month over month.
- Customers with Active Subscriptions: See how many people are currently subscribed. Like many of the features in Enhanced Analytics, you can drill down into any of the variables here for more insights. This helps you find out more about your customers beyond their subscription status and identify changes over time to see where you’re going wrong–or right.
- Month-over-Month Changes in Total Sales: Identify where sales trends are heading, analyze the effectiveness of specific campaigns, and find the LTV of the customers these campaigns brought.
Who is enhanced analytics for?
Recharge Enhanced Analytics is for any store that wants to take a deep dive into their numbers. The minimum requirements include enrollment in Recharge Pro.
Keep in mind that there are some limitations: For example, we currently do not have a way to incorporate migrated customers. That means you should only plan on using the Customer Cohort and Cohort Retention dashboards for signups that occur after you migrate to Enhanced Analytics.
If you’re currently using OneClickUpsell or Carthook, keep in mind that the first subscription charge totals do not get reported in Recharge, but we will report on the customers and subscriptions that relate to these initial charges.
Next steps: Join the beta or apply for pro membership
Enhanced Analytics is only available to Recharge users on the Pro plan and is currently at the Closed Beta stage. (Note: You can find out more about Enhanced Analytics by visiting our support page for its Closed Beta process.)
That means you have two options for your next steps:
- Apply for Recharge Pro. Scroll down to “Request Access” and fill out your company information to find out more.
- If you’re already on Recharge Pro, you can request access to the Closed Beta.
If knowledge is power, then the quality of your data can make all the difference. Use Enhanced Analytics to reduce churn, optimize your campaigns, and build more long-term value in each customer.


